
In today’s highly competitive e-commerce landscape, making data-driven decisions is no longer a luxury but a necessity for survival and growth. Understanding your customers, analyzing their behavior, and identifying key performance indicators (KPIs) can give you a significant edge over your rivals. By harnessing the power of e-commerce analytics, you can unlock valuable insights that will propel your business forward.
This article will delve into the essential e-commerce analytics every business owner should track. From website traffic and customer engagement to sales performance and marketing effectiveness, we’ll cover key metrics that provide a holistic view of your online business’s health. Gaining a deep understanding of these metrics empowers you to optimize your website, refine your marketing strategies, and ultimately boost your revenue.
Website Traffic Metrics: Visitors, Bounce Rate, and Time on Site
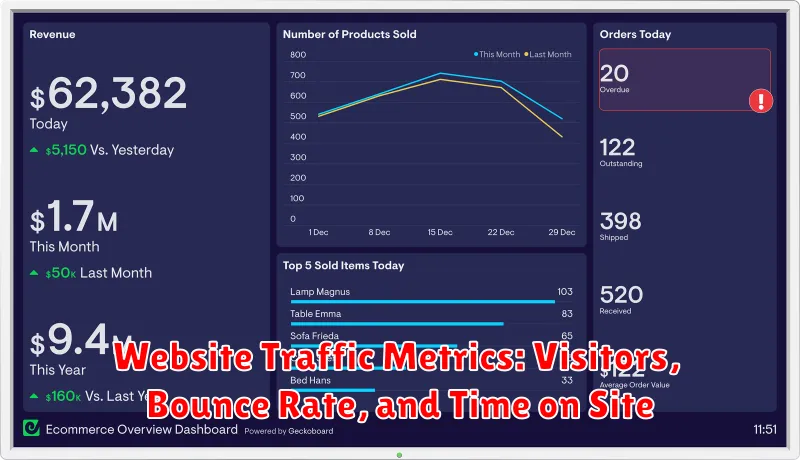
Understanding your website traffic is crucial for any e-commerce business. By analyzing key metrics, you gain valuable insights into user behavior and identify areas for improvement. Three fundamental metrics to focus on are visitors, bounce rate, and time on site.
Visitors refer to the number of unique individuals who visit your website within a specific timeframe. This metric provides a general overview of your website’s reach and popularity. A higher number of visitors typically indicates a greater level of interest in your products or services.
Bounce rate represents the percentage of visitors who leave your website after viewing only one page. A high bounce rate can signal problems with your website’s design, content, or user experience. It might indicate that visitors are not finding what they are looking for or that your website is not engaging enough to keep them browsing.
Time on site measures the average duration visitors spend on your website. This metric provides insights into user engagement and the quality of your content. A longer time on site suggests that visitors are finding your content valuable and are interested in learning more about your offerings.
By tracking these essential website traffic metrics, you can gain a comprehensive understanding of how users interact with your website. This information can then be used to optimize your website’s design, content, and user experience, leading to increased conversions and business growth.
Conversion Rate Optimization: Tracking and Improving Sales Funnels
Conversion rate optimization (CRO) is a crucial aspect of e-commerce success, focusing on maximizing the percentage of website visitors who convert into customers. Tracking and optimizing your sales funnel is essential for identifying areas for improvement and driving growth. By understanding the journey customers take on your website, you can pinpoint bottlenecks and implement strategies to increase conversions.
Tracking key metrics within the sales funnel provides invaluable insights into customer behavior. These metrics include:
- Traffic sources: Where are your visitors coming from?
- Bounce rate: Are visitors leaving your website immediately?
- Average session duration: How long are visitors spending on your website?
- Pages per session: How many pages are visitors browsing?
- Cart abandonment rate: How many visitors add items to their cart but don’t complete the purchase?
- Conversion rate: What percentage of visitors are completing their purchases?
Once you’ve identified key metrics and potential areas for improvement, you can implement CRO strategies to optimize your sales funnel. These strategies include:
- Improving website design: Ensuring a user-friendly and visually appealing website enhances customer experience.
- Simplifying the checkout process: Streamlining the checkout process reduces friction and increases conversion rates.
- Offering incentives: Discounts, free shipping, and loyalty programs can encourage purchases.
- Implementing targeted content: Using personalized content to engage specific audience segments can boost conversions.
- A/B testing: Experimenting with different website variations allows you to identify optimal elements for conversions.
By continuously monitoring your sales funnel and implementing data-driven optimization strategies, you can significantly enhance your conversion rates and drive sustainable growth for your e-commerce business.
Customer Acquisition Cost (CAC): Measuring Marketing ROI
In the competitive world of e-commerce, it’s crucial to understand how much it costs to acquire a new customer. Customer Acquisition Cost (CAC) is a key metric that measures the average cost you incur to attract a new customer. By tracking CAC, you can gauge the effectiveness of your marketing campaigns and make data-driven decisions to optimize your spending.
To calculate your CAC, simply divide your total marketing expenses over a specific period by the number of new customers acquired during that time. For example, if you spent $10,000 on marketing and acquired 500 new customers, your CAC would be $20.
Why is CAC important?
- It helps you understand your marketing ROI: By comparing CAC to your average customer lifetime value (CLTV), you can determine if your marketing efforts are profitable.
- It allows you to optimize your marketing spend: By identifying high-performing marketing channels and campaigns, you can allocate more resources to them and reduce spending on less effective ones.
- It helps you track your growth: Monitoring your CAC over time can reveal trends in your marketing effectiveness and help you identify areas for improvement.
By actively monitoring and analyzing your CAC, you can make informed decisions about your marketing strategies, ensuring that you are acquiring customers efficiently and driving sustainable growth for your e-commerce business.
Average Order Value (AOV): Increasing Revenue per Sale
Average order value (AOV) is a vital metric that measures the average amount of money customers spend per order. It’s a crucial indicator of your business’s revenue potential and a key metric for identifying opportunities to increase revenue per sale. By analyzing your AOV, you can gain valuable insights into customer behavior and find ways to encourage larger orders.
Here’s how to calculate AOV:
AOV = Total Revenue / Number of Orders
Increasing AOV can be achieved through several strategies:
- Offer bundles and packages: This encourages customers to purchase multiple items at once, increasing their average order value.
- Implement upselling and cross-selling techniques: Suggesting complementary or higher-priced items during checkout can significantly boost AOV.
- Provide free shipping with minimum order value: This incentivizes customers to reach a certain spending threshold to qualify for free shipping, increasing their average order value.
- Offer discounts and promotions for larger orders: Reward customers for spending more by offering discounts or special deals on bulk purchases.
By tracking and improving your AOV, you can optimize your sales strategy and drive sustainable revenue growth for your ecommerce business.
Customer Lifetime Value (CLTV): Building Long-Term Relationships
In the competitive landscape of e-commerce, it’s not enough to just make a sale. You need to cultivate lasting relationships with your customers. This is where understanding Customer Lifetime Value (CLTV) comes in. CLTV measures the total revenue a customer is expected to generate throughout their relationship with your business. It’s a powerful metric that can help you make data-driven decisions about customer acquisition, retention, and marketing.
By focusing on CLTV, you can prioritize attracting and retaining valuable customers who will contribute significantly to your long-term success. Here are some key benefits of understanding CLTV:
- Targeted marketing campaigns: CLTV allows you to segment your customers based on their value and tailor your marketing messages accordingly. You can invest more in retaining high-value customers and nurture those with potential to become high spenders.
- Improved customer experience: By understanding what makes your most valuable customers happy, you can design better products, services, and customer experiences. This can lead to increased customer satisfaction and loyalty.
- Sustainable growth: Focusing on CLTV helps you build a business that’s not just about short-term profits but also about long-term sustainability. By nurturing customer relationships, you create a loyal base that can drive continuous revenue growth.
There are several ways to calculate CLTV, but the most common approach involves considering factors like average purchase value, purchase frequency, and customer lifespan. You can use dedicated CLTV tools or formulas to get a clear picture of your customers’ lifetime value.
Understanding and leveraging CLTV is crucial for any e-commerce business looking to thrive in a competitive market. By prioritizing customer relationships and focusing on long-term value, you can build a sustainable business that delivers exceptional customer experiences and drives consistent revenue growth.
Product Performance Analysis: Identifying Bestsellers and Underperformers
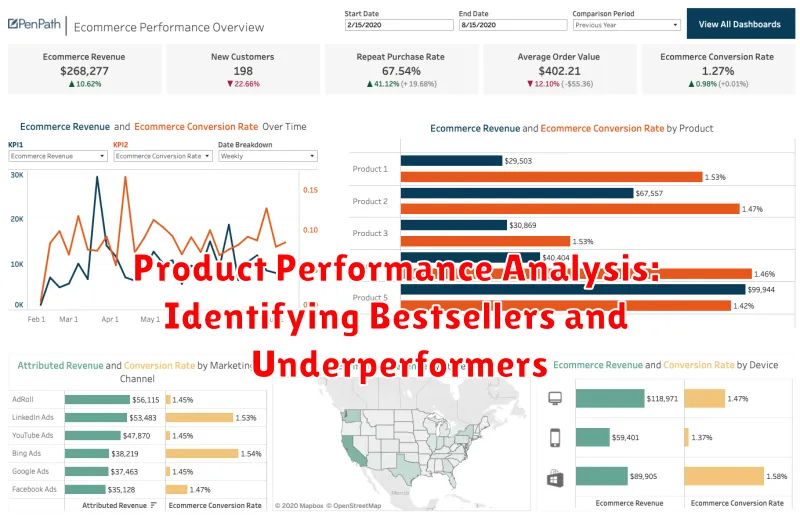
Product performance analysis is a critical component of any successful e-commerce strategy. By understanding which products are your bestsellers and which are underperforming, you can make data-driven decisions to optimize your inventory, marketing efforts, and overall profitability.
Here are some key metrics to track for product performance analysis:
- Sales volume: How many units of each product have been sold in a given period?
- Revenue: How much revenue has each product generated?
- Average order value: What is the average amount spent on products in each category?
- Conversion rate: How often do customers who view a product actually purchase it?
- Customer reviews: What are customers saying about the product?
By analyzing these metrics, you can identify your top-performing products, which often warrant increased marketing spend and inventory investment. Conversely, you can also pinpoint underperforming products that may need to be discontinued, discounted, or redesigned.
The insights gained from product performance analysis can be used to:
- Optimize product pricing and promotions.
- Improve product descriptions and images.
- Target marketing campaigns more effectively.
- Forecast inventory needs more accurately.
- Improve customer satisfaction.
Ultimately, product performance analysis allows you to make more informed decisions about your e-commerce business. By understanding which products are driving your success, you can focus your efforts on maximizing profitability and achieving your business goals.
Inventory Management: Optimizing Stock Levels and Reducing Costs
Effective inventory management is crucial for any e-commerce business. It directly impacts your profitability, customer satisfaction, and overall business efficiency. By optimizing stock levels, you can minimize the risk of stockouts and overstocking, leading to substantial cost reductions and improved operational performance.
Tracking key inventory metrics is essential for making data-driven decisions. These metrics include:
- Inventory Turnover Rate: Measures how quickly your inventory is sold. A higher turnover rate indicates efficient inventory management.
- Days Sales of Inventory (DSI): Calculates the average number of days it takes to sell your inventory. A lower DSI suggests faster inventory movement.
- Stockout Rate: Tracks the percentage of orders that cannot be fulfilled due to insufficient inventory. Reducing stockouts improves customer satisfaction and sales.
- Inventory Holding Cost: Calculates the cost associated with storing inventory, including warehousing, insurance, and obsolescence. Minimizing holding costs improves profitability.
By analyzing these metrics, you can identify areas for improvement. For instance, a high stockout rate might indicate inadequate forecasting or slow supplier lead times. Conversely, a low inventory turnover rate could suggest overstocking and excess inventory holding costs.
Implementing data-driven strategies, such as utilizing inventory management software, can streamline processes and optimize stock levels. These tools provide insights into historical sales trends, demand forecasting, and order fulfillment, allowing for informed inventory decisions. Moreover, they can automate tasks like reorder point calculations and inventory tracking, freeing up your time for more strategic initiatives.
By proactively managing your inventory based on data, you can ensure that you have the right products in the right quantities at the right time. This leads to reduced costs, increased customer satisfaction, and a more profitable e-commerce business.
Shopping Cart Abandonment Rate: Recovering Lost Sales
The shopping cart abandonment rate is a critical metric that reflects the percentage of customers who add items to their shopping carts but don’t complete the purchase. This metric holds significant weight, as it directly impacts your revenue and reveals crucial insights into customer behavior. A high abandonment rate can point to various issues, including complex checkout processes, hidden fees, lack of trust, and limited payment options. It’s imperative to understand the reasons behind cart abandonment to address them effectively and increase conversion rates.
To effectively lower your shopping cart abandonment rate, you need to analyze the data. By monitoring this metric, you can identify patterns and uncover the factors contributing to the high abandonment rate. Once you have a clear understanding of the reasons, you can implement targeted strategies to mitigate them. These strategies might include streamlining the checkout process, offering clear pricing, providing security assurance, and enhancing payment flexibility.
By proactively addressing the issues that lead to cart abandonment, you can significantly increase conversion rates and boost your revenue. Regularly monitoring and analyzing your shopping cart abandonment rate allows you to make data-driven decisions that improve customer experience and drive business growth.
Email Marketing Metrics: Open Rates, Click-Through Rates, and Conversions
Email marketing is an incredibly effective way to reach your target audience and drive sales, but how do you know if your campaigns are actually working? That’s where email marketing metrics come in. By tracking key metrics, you can gain valuable insights into your audience’s behavior and make data-driven decisions to optimize your campaigns for better results.
One of the most important metrics to track is your open rate. This metric tells you what percentage of recipients opened your email. A high open rate indicates that your subject line is compelling and that your email is relevant to your audience. To improve your open rate, try testing different subject lines, segmenting your list, and sending emails at optimal times.
Another crucial metric is your click-through rate (CTR). This metric measures the percentage of recipients who clicked on a link in your email. A high CTR suggests that your email content is engaging and that your call to action is effective. To increase your CTR, focus on creating visually appealing and informative content, use strong calls to action, and optimize your email design for mobile devices.
Ultimately, the most important metric is your conversion rate. This metric tells you what percentage of recipients who clicked on a link in your email actually completed a desired action, such as making a purchase or signing up for a newsletter. To improve your conversion rate, ensure that your landing pages are optimized for conversions, offer compelling incentives, and track your results to identify areas for improvement.
By tracking these essential email marketing metrics, you can gain a better understanding of your audience’s behavior and optimize your campaigns for maximum impact. Remember, data is key to success in email marketing. By analyzing your results and making data-driven decisions, you can drive better results and achieve your business goals.
Social Media Engagement: Measuring Brand Reach and Customer Interaction
Social media has become an indispensable tool for businesses, offering a powerful platform to connect with customers, build brand awareness, and drive sales. To leverage the full potential of social media, it’s crucial to track engagement metrics that provide insights into your brand’s reach and customer interaction. By understanding how your audience interacts with your content, you can refine your strategy, optimize your efforts, and ultimately achieve better results.
Key metrics to measure social media engagement include:
- Reach: The number of unique users who saw your content.
- Impressions: The total number of times your content was displayed, regardless of whether it was clicked or not.
- Engagement Rate: The percentage of users who interacted with your content (likes, comments, shares, etc.).
- Click-Through Rate (CTR): The percentage of users who clicked on a link in your post.
- Website Traffic: The number of visitors driven to your website from social media.
- Social Media Mentions: The number of times your brand is mentioned on social media, including both positive and negative feedback.
By analyzing these metrics, you can gain valuable insights into:
- The effectiveness of your content: What types of posts resonate with your audience the most?
- The reach of your campaigns: How effectively are you reaching your target audience?
- Customer sentiment: What do your customers think about your brand?
- Areas for improvement: What can you do to improve engagement with your content?
Tools to measure social media engagement:
Various tools can help you track and analyze your social media engagement metrics. Some popular options include:
- Facebook Insights: Provides in-depth analytics for your Facebook page.
- Twitter Analytics: Offers insights into your Twitter performance.
- Instagram Insights: Tracks your Instagram engagement.
- Google Analytics: Tracks website traffic from social media.
- Third-party social media management tools: Platforms like Hootsuite, Buffer, and Sprout Social offer comprehensive analytics dashboards.
By tracking and analyzing your social media engagement metrics, you can make data-driven decisions to improve your strategy, optimize your content, and maximize your return on investment.
Customer Segmentation: Personalizing Marketing Efforts
Customer segmentation is a crucial aspect of data-driven marketing for ecommerce businesses. It involves grouping customers into distinct segments based on shared characteristics, such as demographics, purchasing behavior, and website interactions. By understanding these segments, you can tailor your marketing efforts to resonate with each group’s unique needs and preferences.
For example, you could segment customers based on their purchase history, identifying those who frequently buy certain products or brands. This allows you to send personalized recommendations and promotional offers that are relevant to their interests. You can also create segments based on customer demographics, such as age, gender, or location, to target specific groups with targeted ads and promotions.
Beyond traditional segmentation methods, you can leverage data analytics to create more sophisticated segments based on customer behavior. For instance, you can identify “high-value customers” who consistently make large purchases or “lapsed customers” who haven’t made a purchase in a while. This allows you to tailor your marketing strategy to retain valuable customers and re-engage those who have become inactive.
By segmenting your customers and personalizing your marketing efforts, you can achieve several benefits:
- Increased conversion rates by delivering relevant messages and offers
- Improved customer engagement through personalized communications
- Higher customer lifetime value by nurturing relationships and retaining valuable customers
- More efficient marketing spend by targeting the right customers with the right messages
To implement effective customer segmentation, you need to gather and analyze customer data from various sources, such as website analytics, CRM systems, and customer surveys. This data can be used to create detailed customer profiles and identify the key characteristics that define each segment.
In conclusion, customer segmentation is a powerful tool for ecommerce businesses to personalize their marketing efforts and achieve better results. By leveraging data to understand your customers, you can create targeted campaigns that resonate with their needs and drive conversions, engagement, and long-term customer loyalty.
Analyzing and Interpreting Ecommerce Data for Actionable Insights
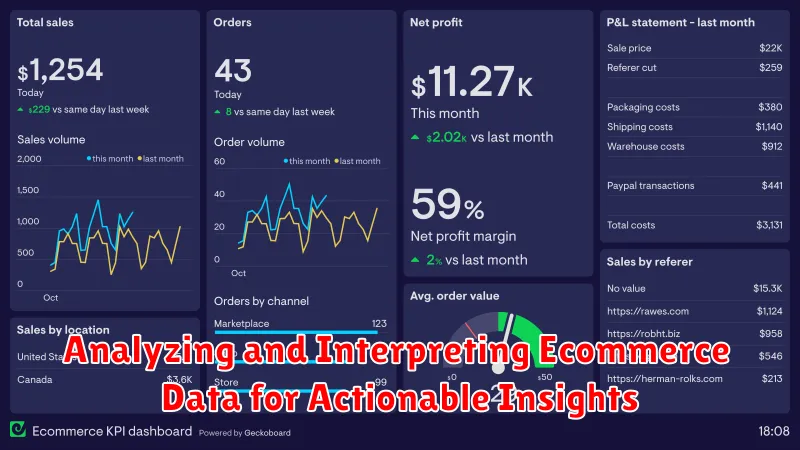
Ecommerce data is a goldmine of information that can be used to understand customer behavior, identify areas for improvement, and ultimately, drive more sales. However, simply collecting data isn’t enough. The real value lies in analyzing and interpreting that data to uncover actionable insights.
Here’s a breakdown of key steps to effectively analyze and interpret your ecommerce data:
- Define Your Goals: Start by identifying your business objectives. Are you looking to increase conversion rates, boost average order value, or improve customer retention? Your goals will guide the specific metrics you track and the insights you prioritize.
- Choose the Right Tools: There are a multitude of tools available for ecommerce analytics, from basic Google Analytics to more advanced platforms like Shopify Analytics or Adobe Analytics. Select a tool that aligns with your needs and technical expertise.
- Track Key Metrics: Focus on metrics that directly relate to your goals. Some essential metrics include:
- Website traffic (sessions, unique visitors, bounce rate)
- Conversion rate (the percentage of visitors who complete a purchase)
- Average order value (the average amount spent per order)
- Customer lifetime value (the total revenue generated from a single customer)
- Customer acquisition cost (the cost of acquiring a new customer)
- Product performance (best-selling products, underperforming products)
- Identify Trends and Patterns: Look for patterns and trends in your data. Are there specific days or times when sales are higher? What are the most popular products or categories? What are the common customer demographics? Understanding these patterns can reveal opportunities for optimization.
- Test and Iterate: Don’t be afraid to experiment and try new approaches. Implement changes based on your data analysis, and track the results. Regularly review and refine your strategies for continuous improvement.
By analyzing and interpreting your ecommerce data effectively, you can gain valuable insights into your business, identify areas for improvement, and make data-driven decisions that drive growth and success.